
Paste, Click, Download: A Free Chart Tool That Asks for Nothing
Most charts are born out of urgency. A quarterly review is tomorrow morning, a thesis chapter needs one clean figure, or a client deck has an empty slide where a trend line should be. The data already exists in a spreadsheet, yet turning those rows and columns into something presentable still takes far longer than it should: restyling defaults, aligning labels, exporting at a decent resolution, and repeating the whole dance the next time the numbers change. A free chart builder that skips the ceremony changes that equation entirely — paste the table, pick a shape, download the image, and move on with your day.
From Raw Table to Finished Chart in About a Minute
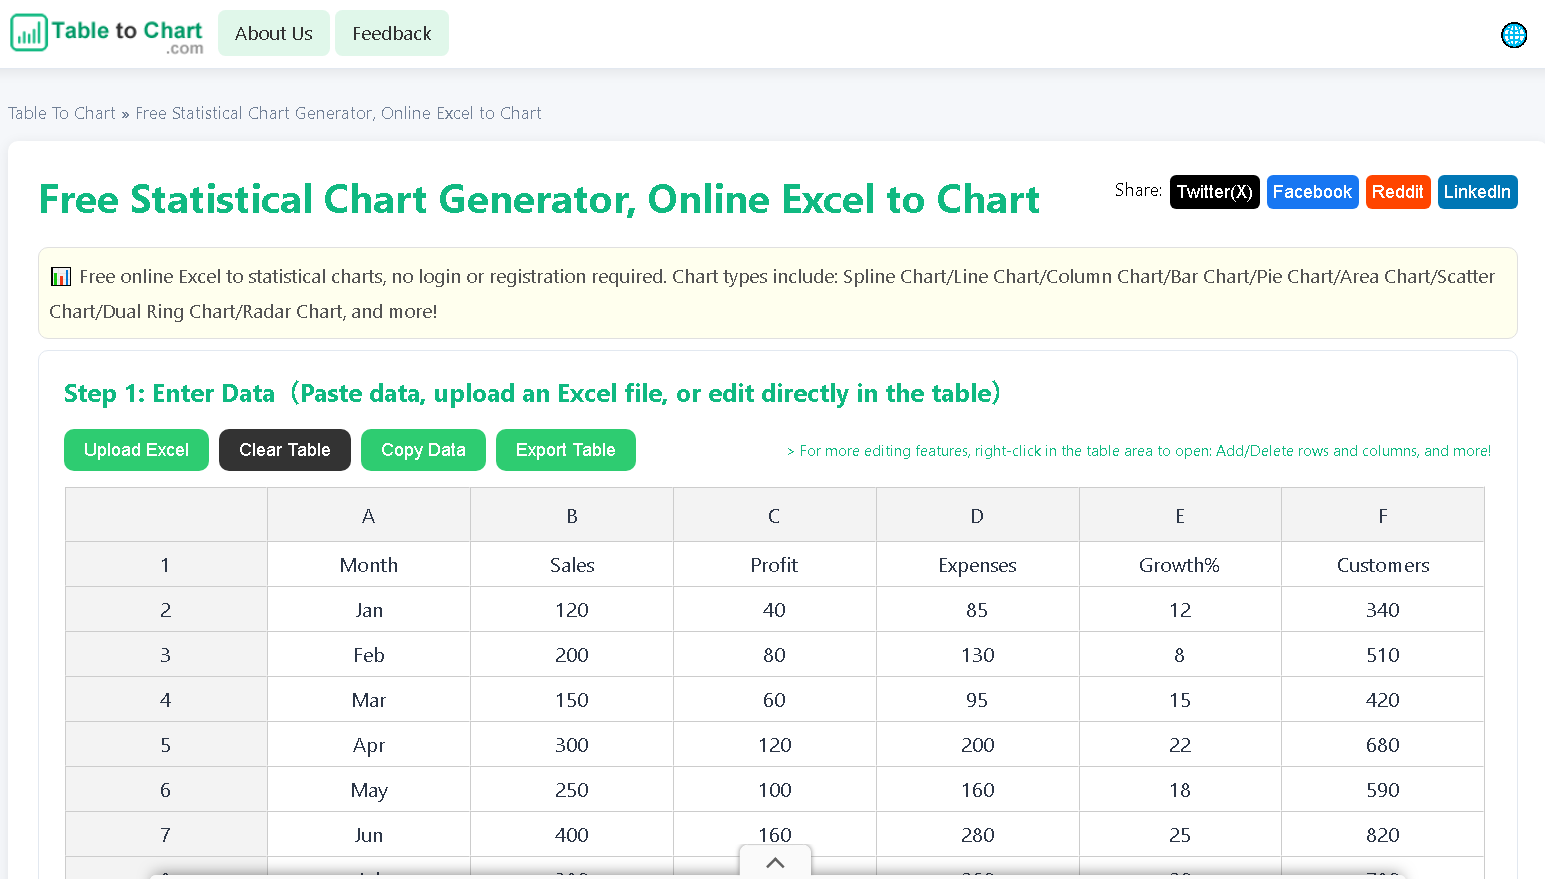
The workflow is deliberately short. Copy a range from Excel, Google Sheets, or any CSV-style source and paste it into the editor, or upload an .xlsx or .xls file directly and let the tool detect the table structure on its own. The editing grid grows with your data, so there is no manual resizing step before you start. Choose one of eleven chart types, render with a single click, and export a high-resolution image straight into slides, documents, or web pages. First-time users routinely go from raw numbers to a finished graphic in under sixty seconds, which matters most exactly when the deadline is measured in hours rather than days.
Eleven Chart Types Without a Paywall Between Them
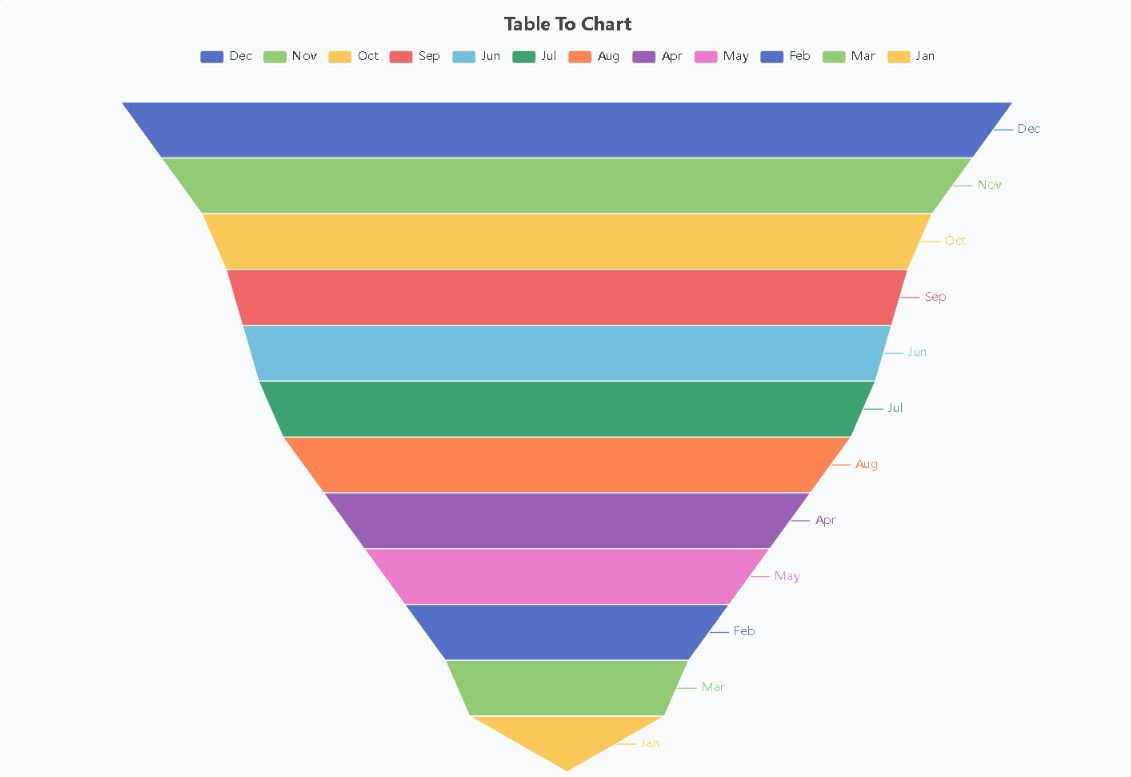
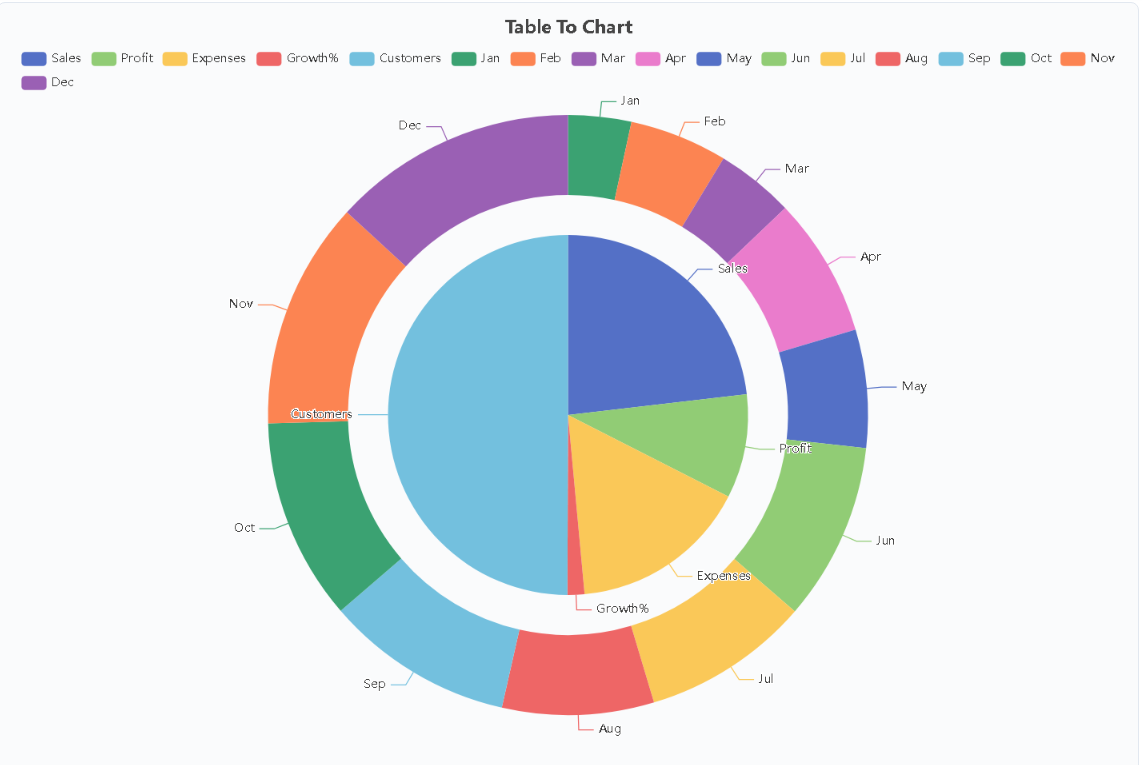
Coverage is the quiet strength here: spline, line, column, bar, pie, area, scatter, dual ring, radar, heatmap, and funnel. Time-series trends, side-by-side comparisons, and part-to-whole compositions are all reachable from the same page, and every type exports at full quality. Contrast that with the standard desktop routine, where polishing one statistical figure means a dozen rounds of clicking through style dialogs — font sizes here, legend placement there, then fixing the layout that the previous tweak broke. Or compare it with the typical freemium web tool, where the chart you actually need sits behind a “pro” badge and the free tier stamps a watermark across your work. Here there is no locked menu and no branded overlay: if a feature exists on the page, it is usable right now.
What It Refuses to Do Is the Real Feature List
Free utilities usually come with strings attached, and the honest ones state them up front. This one takes the opposite approach by removing the usual strings altogether: no account creation, no email address harvested at the door, no “continue with Google” wall. No watermark on exported images. No countdown timers, trial traps, or upgrade pop-ups interrupting the work. Nothing about the session is kept on a server, either. Consider two concrete situations where that absence matters. A teacher preparing a lesson diagram from student grades cannot afford to have minors’ data sitting on a third-party server. An analyst polishing internal sales figures for a board pack faces the same constraint with commercially sensitive numbers. Because every chart is rendered locally in the browser, closing the tab ends the story — the tables and graphics were never uploaded, never logged, and never retained.
Who Reaches for It and Why They Stay
The audience splits into recognizable groups. Students convert lab measurements into figures they can hand in. Teachers assemble diagrams for the next morning’s class. Analysts turn a rough export into something a stakeholder can read at a glance. Founders, marketers, and small-business owners need exactly one chart for exactly one deck and have no interest in another subscription. Students who once wrestled with spreadsheet style panels now paste and export; small teams that once waited on a designer for a single visual now produce it themselves between meetings. If you want to try the workflow yourself, you can generate charts free with TableToChart and see how the paste-to-image loop feels. The common thread across all these users is simple: they needed a chart, not an account, and the tool respects that distinction.